System Status tab
Use the information in this topic to understand the options under the System Status tab.
This section provides information for using the options under the System Status tab on the IMM2 web user interface.
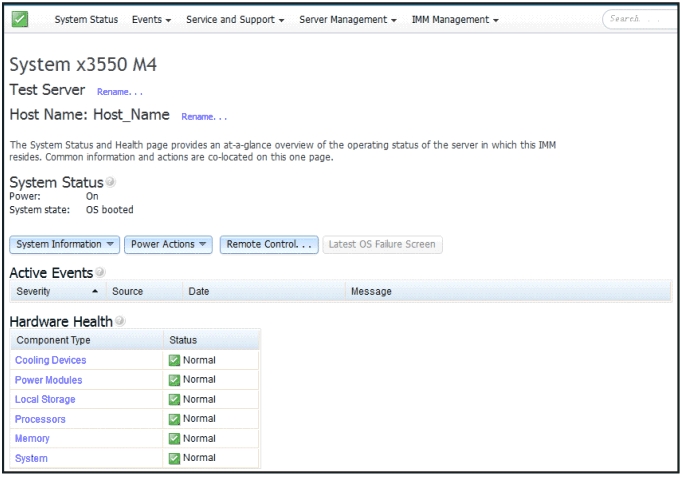
The System Status page is displayed after you log into the IMM2 web user interface or when you click the System Status tab. From the System Status page, you can view the system status, active system events, and hardware health information. The following window opens when you click the System Status tab or log into the IMM2 web interface.
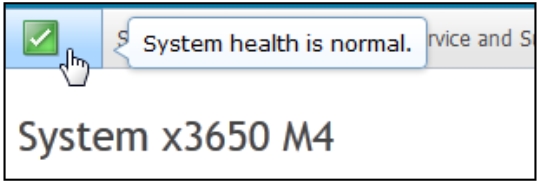
You can click on the green icon (with the check mark) in the upper left corner of the page to get a quick summary of the server health. A check mark indicates that the server is operating normally.
If a red circle or a yellow triangle icon is displayed, this indicates that an error or warning condition exists, as shown in the following illustration.
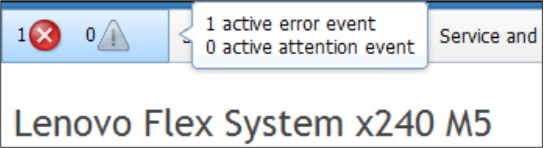
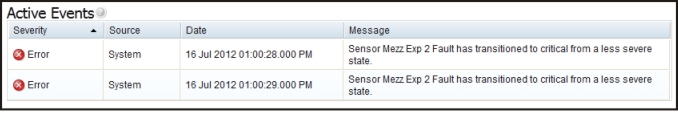
The red circle icon indicates that an error condition exists on the server. A yellow triangle icon indicates that a warning condition exists. When a red circle or a yellow triangle icon is displayed, the events associated with that condition are listed under the Active Events section on the System Status page, as shown in the following illustration.
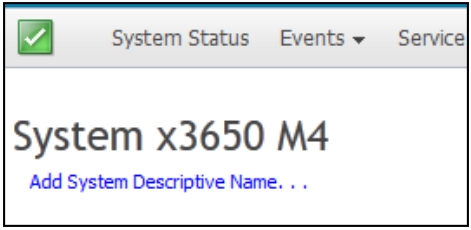
You can add a descriptive name to the IMM2 server to assist you in identifying one IMM2 server from another. To assign a descriptive name to the IMM2 server, click the Add System Descriptive Name... link located below the server product name.
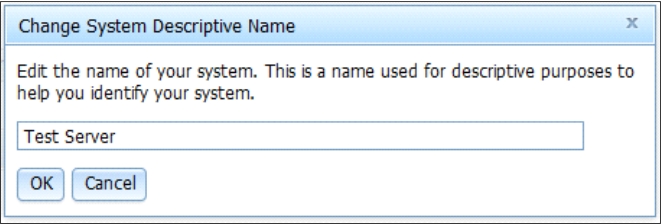
When you click the Add System Descriptive Name... link, the following window opens for you to specify a name to associate with the IMM2 server. You can change the System Descriptive Name at any time.
If you click the Rename... link beside the Host Name, the Network Protocol Properties page opens. You can use the Network Protocol Properties page to configure the Host Name on the Ethernet tab. See Configuring network protocols for additional information.
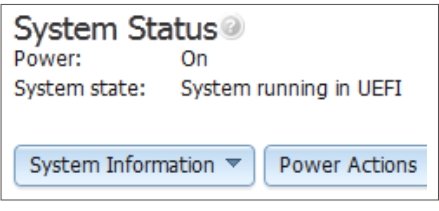
The System Status section on the System Status page provides the server power state and operating state of the server. The status that is displayed is the server state at the time the System Status page is opened, (as shown in the following illustration).
The server can be in one of the following states described in the following table:
| Server state | Description |
|---|---|
| System power off/state unknown | The server is off. |
| System on/starting UEFI | The server is powered on, but UEFI is not running. |
| System running in UEFI | The server is powered on and UEFI is running. |
| System stopped in UEFI | The server is powered on; UEFI has detected a problem and has stopped running. |
| Booting OS or in unsupported OS | The server might be in this state for one of the following reasons:
|
| OS booted | The server operating system is running. |
| Suspend to RAM | The server has been placed in standby or sleep state. |
| System Running in Setup | The server is powered on and UEFI has booted into F1 setup menu |
The System Status page will display a message when an error or warning condition occurs, as seen in the following illustration.
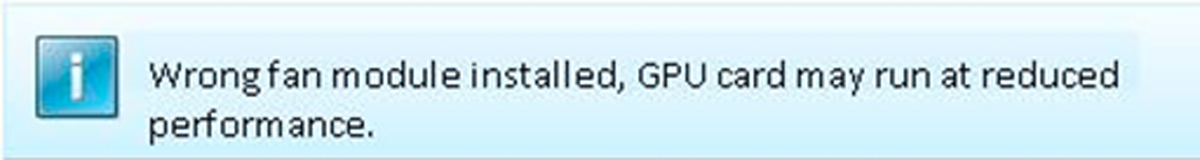
- “Wrong fan module installed, GPU card may run at reduced performance.”
- “Unknown fan module status”
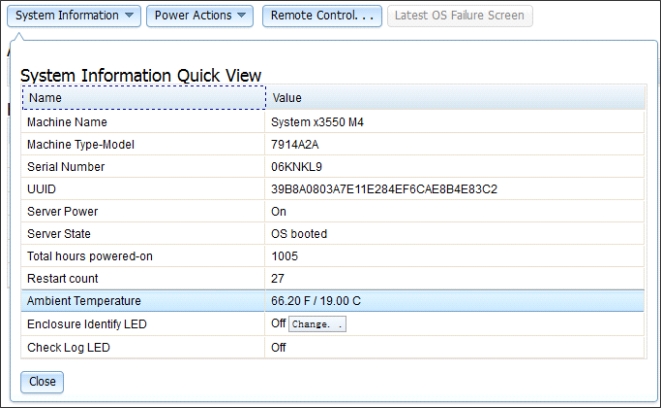
The System Status page also provide tabs for System Information, Power Actions, Remote Control, and Latest OS Failure Screen.

Click the System Information tab to view information about the server
Click the Power Actions tab to view the actions that you can perform for full remote power control over the server with power-on, power-off, and restart actions. See Controlling the power status of the server for details about how to remotely control the server power.
Click the Remote Control tab for information on how to control the server at the operating system level. See Remote presence and remote control functions for details about the Remote Control function.
Click the Latest OS Failure Screen tab for information on how to capture the Latest OS Failure Screen data. See Capturing the latest OS failure screen data for details about the Latest OS Failure Screen.
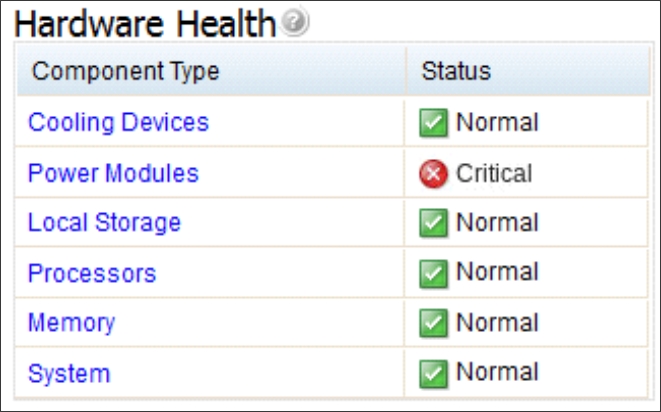
Under the Hardware Health section of the System Status page is a table with a list of the hardware components that are being monitored and their health status. The status displayed for a component might reflect the most critical state of the component in the Component Type column in the table. For example, a server might have several power modules installed and all of the power modules are operating normally except one. The status for the Power Modules components in the table will have a status of critical because of that one power module (as shown in the following illustration).
Each component type is a link that you can click to get more detailed information. When you click on a component type, a table listing the status for each of the individual components is displayed (as shown in the following illustration).
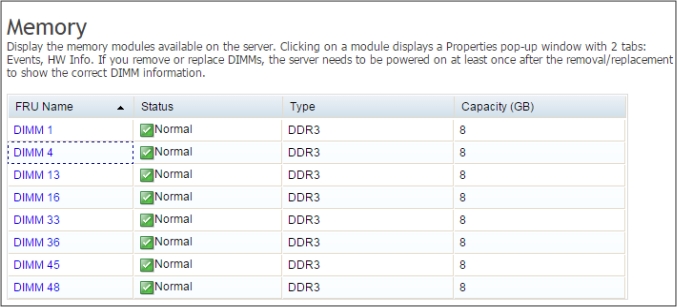
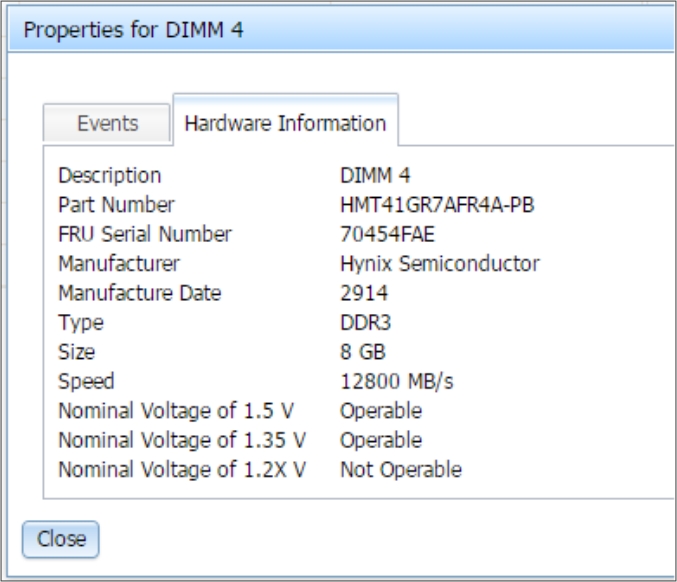
You can click on a component in the FRU Name column of the table to obtain additional information for that component. All active events for the component will be displayed.
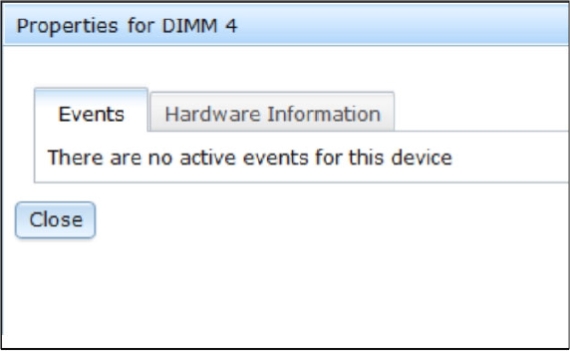
Click on the Hardware Information tab for detailed information about the component.